Data and Urban Planning
Tracking the Pulse of the City
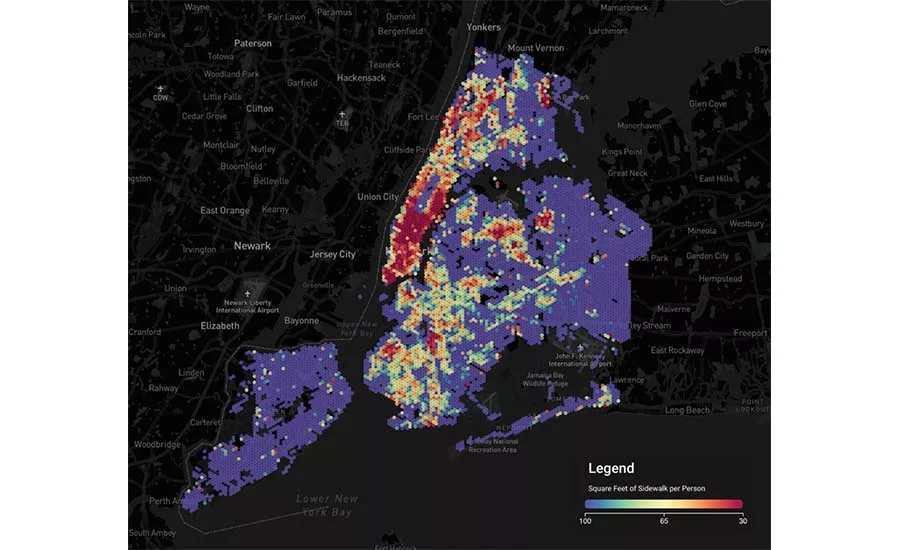
A tool developed by KPF predicts the contribution of residents, workers, and others to “sidewalk stress” at different times of day. Image courtesy KPF
The rise of big tech and the proliferation of digital information is often cast in dystopian terms; consumers unwittingly consent to the hoovering of reams of private data by corporate overlords, who, in turn, customize product offerings through algorithms that apparently know us better than we do ourselves. Lost in this dialogue is the ongoing application and potential of data in solving intractable inequities that hamper urban sustainability and overall prosperity.
The MIT Senseable City Lab in Cambridge, Massachusetts, has been grappling with these issues since its founding in 2004. According to Carlo Ratti, director of the lab and founding partner of the architecture firm Carlo Ratti Associati, the wealth of data produced daily is a gold mine for the future understanding of cities. “If we want cities to be structured as well-functioning, human-scale mixed-use neighborhoods—or ‘15-minute cities,’ as Paris mayor Anne Hidalgo would put it—we need to start from a better understanding of today’s imbalances,” says Ratti. “Big data can help us review the existing layouts of different neighborhoods and tweak them on a case-by-case basis. But, of course, flexible, data-informed policy should follow.”
Toward that end, the lab’s work, as demonstrated by recent projects such as Liminal Ghettos, which was featured at the 2021 Porto Design Biennale, builds upon two types of data. “Opportunistic data,” generated as a byproduct of our digitally augmented lives, include those produced through social-media use, self-tracking apps, and anonymized records. The second, broader, category are gathered by sensors, which, for example, can track air quality on city streets or monitor human viruses and wastewater throughout a municipality’s sewage system. Both forms of data are analyzed by the lab and visualized to gauge where interventions are most appropriate to advance equity.
The inspiration for State of Place, an urban design data and predictive-analytics software company, was the personal experience of its founder and CEO, Mariela Alfonzo. Growing up in low- and middle-income suburbs of Miami, Alfonzo witnessed firsthand the detrimental effects of the built environment and urban design on residents’ quality of life. For her, addressing such systemic issues required the development of a tool to measure the independent variables that can be adapted to improve urban precincts and entire cities.
The software collects approximately 300 micro-scale aspects of the built environment’s features—such as the density of trees, quality of the sidewalks, access to healthful food—and ranks that particular neighborhood within the State of Place Index. The team then takes those qualities and predicts how their improvement could positively impact health and environmental problems, such as diabetes and lung disease, as well as the economic position of municipalities. The company has collaborated with cities across the world, including Irvine, California, on evaluations of redevelopment opportunities, and Oslo, on the walkability of its Økern district. In Philadelphia, in collaboration with SmartCityPHL, State of Place led a pilot project that collected data on approximately 15,000 city blocks and demonstrate that a slight increase in an area’s Index score, through improved public space or greater access to bike lanes, could reduce the prevalence of chronic diseases like obesity and asthma.
“Data are a way to help break up departmental silos,” explains Alfonzo. “You can start to objectively show that, through interdepartmental collaboration, cities are more cost-effective and their key performance indicators improve. The real-life implications of that approach are happier and healthier residents.”
In New York, KPF Associates’ Urban Interface think tank is probing similar questions, and is developing interactive web tools that empower non-expert stakeholders to freely explore data to their advantage. The team is applying data analytics and custom evaluation applications to gauge the impact of their own projects within urban contexts, such as the Midtown Manhattan supertall One Vanderbilt, where daylight and pedestrian-flow studies informed both the massing of the tower and the layout of public spaces. For the latter, the team is developing a new toolkit to guide public-space design that addresses time-specific use demands.
Looking for quick answers on architecture and design topics?
Try Ask RECORD, our new smart AI search tool.
Ask RECORD →
“We map the flows of pedestrian volume in relationship to daylight, thermal comfort, and vehicular traffic to create a shared street schedule,” says KPF director and urban interface leader Luc Wilson. “By allowing the street and sidewalk spaces to be used more flexibly, for example, to accommodate distinct surges and lulls in pedestrian traffic, temporal design helps maximize the usability of the public realm and, in effect, gets more space for meaningful programming without having to building anything new.”
The use of data in city planning has come a long way since the pioneering epidemiologist John Snow’s campaign of disease mapping in 19th-century London, and the inexorable march of big tech is sure to produce ever greater caches of information on how cities, spaces, and infrastructure are being used or underutilized by residents. The existential question is whether those resources can be harnessed to establish more equitable and successful cities.
Looking for a reprint of this article?
From high-res PDFs to custom plaques, order your copy today!